機械学習手習い: サポートベクターマシン
「入門 機械学習」手習い、12日目。「12章 モデル比較」です。
最後のアルゴリズム、サポートベクターマシン(SVM)を学び、最後に同じデータセットにロジスティック回帰やk近傍法など、今まで学んできたアルゴリズムを適用して比較します。
# 前準備
> setwd("12-Model_Comparison/")
サポートベクターマシン(SVM)
サポートベクターマシンは、分類モデルの一つで、ロジスティック回帰と違い、非線形の決定境界を持つデータもうまく分類することができます。
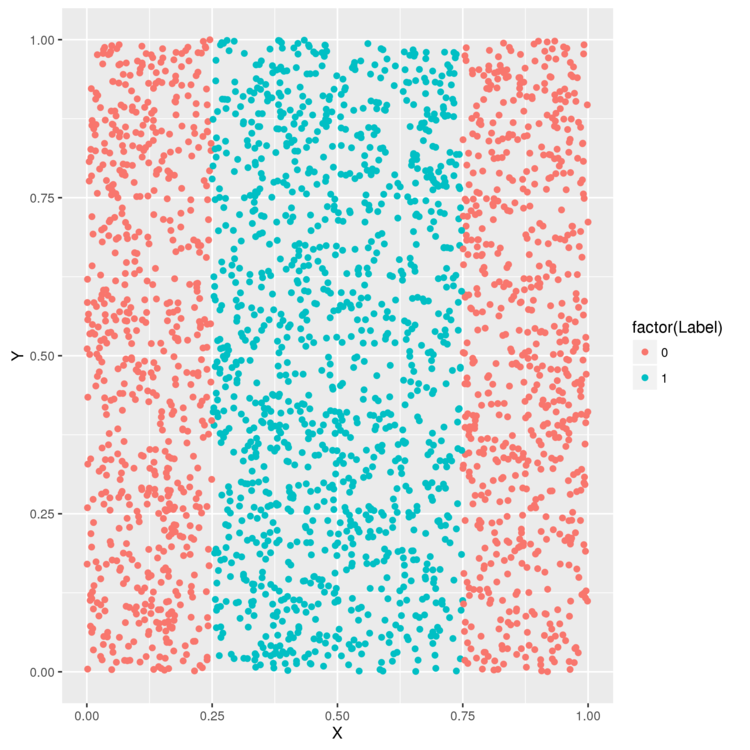
例えば、以下のようなデータ。決定境界が1つの線で表せないため、ロジスティック回帰ではうまく分類できません。
> library('ggplot2')

# データを読み込み
> df <- read.csv(file.path('data', 'df.csv'))
> head(df)
          X          Y Label
1 0.2655087 0.52601906     1
2 0.3721239 0.07333542     1
3 0.5728534 0.84974175     1
4 0.9082078 0.42305801     0

> ggplot(df, aes(x = X, y = Y, color = factor(Label))) + geom_point()
> ggsave(filename="plot01.png")
試しに、ロジスティック回帰を使って、任意の点がどのラベルに属するか判定してみます。
> logit.fit <- glm(Label ~ X + Y,
    family = binomial(link = 'logit'), data = df)

> logit.predictions <- ifelse(predict(logit.fit) > 0, 1, 0)
> mean(with(df, logit.predictions == Label))
[1] 0.5156
精度は51.5%。クラスは2つかないので、ランダムに選んだ場合とほぼ変わらない精度です。
次に、SVMで分類した場合の精度も計測してみます。
> library('e1071')

> svm.fit <- svm(Label ~ X + Y, data = df)
> svm.predictions <- ifelse(predict(svm.fit) > 0, 1, 0)
> mean(with(df, svm.predictions == Label))
[1] 0.7204
72%になりました。ロジスティック回帰よりうまく分類できているようです。
各モデルがどのような判定を行っているか、図示してみます。
> library("reshape")
> df <- cbind(df, data.frame(Logit = ifelse(predict(logit.fit) > 0, 1, 0),
  SVM = ifelse(predict(svm.fit) > 0, 1, 0)))

> predictions <- melt(df, id.vars = c('X', 'Y'))

> ggplot(predictions, aes(x = X, y = Y, color = factor(value))) +
  geom_point() + facet_grid(variable ~ .)
> ggsave(filename="plot02.png")
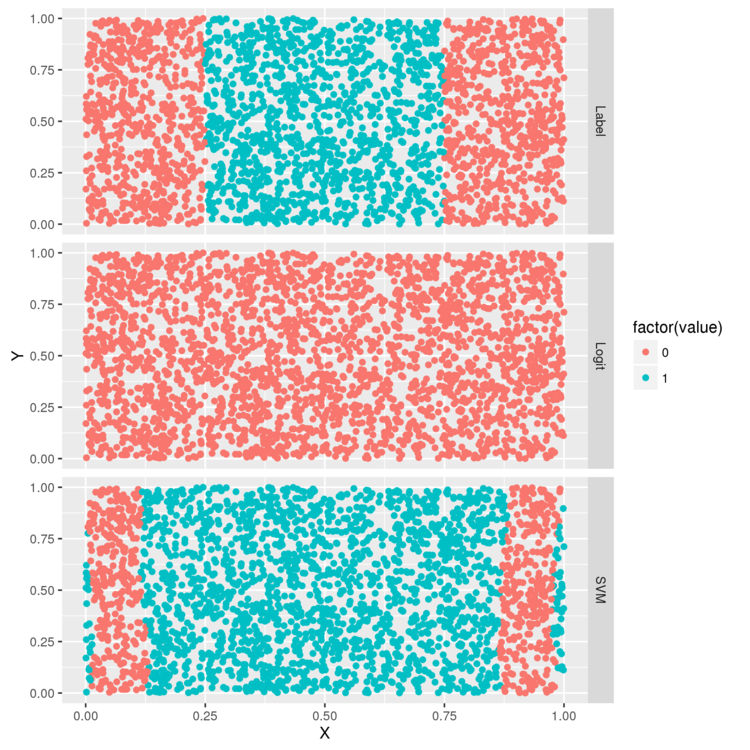
上から、分類対象のデータ、ロジスティック回帰で各点を分類した結果、SVMで各点を分類した結果、です。
ロジスティック回帰は全部0にしている・・・。一方、SVMだと元データの特徴を完全ではないですがうまく捉えているようです。
カーネルトリック
SVMでは、カーネルトリックという手法を使って、非線形の決定境界を生成できるようになっています。 カーネルトリックは、数学的な変換で元のデータセットを新しい空間に移動することで、決定境界を線形でも記述しやすくすします。
何種類かのカーネルで分類を試し、結果を比較してみます。
svm 関数では、引数で利用するカーネルを変更できるので、それを使います。
> df <- df[, c('X', 'Y', 'Label')]

# 線形カーネル
> linear.svm.fit <- svm(Label ~ X + Y, data = df, kernel = 'linear')

# 多項式カーネル
> polynomial.svm.fit <- svm(Label ~ X + Y, data = df, kernel = 'polynomial')

# ガウスカーネル
> radial.svm.fit <- svm(Label ~ X + Y, data = df, kernel = 'radial')

# シグモイドカーネル
> sigmoid.svm.fit <- svm(Label ~ X + Y, data = df, kernel = 'sigmoid')

> df <- cbind(df,
            data.frame(LinearSVM = ifelse(predict(linear.svm.fit) > 0, 1, 0),
                       PolynomialSVM = ifelse(predict(polynomial.svm.fit) > 0, 1, 0),
                       RadialSVM = ifelse(predict(radial.svm.fit) > 0, 1, 0),
                       SigmoidSVM = ifelse(predict(sigmoid.svm.fit) > 0, 1, 0)))

> predictions <- melt(df, id.vars = c('X', 'Y'))

> ggplot(predictions, aes(x = X, y = Y, color = factor(value))) +
  geom_point() + facet_grid(variable ~ .)
> ggsave(filename="plot03.png")
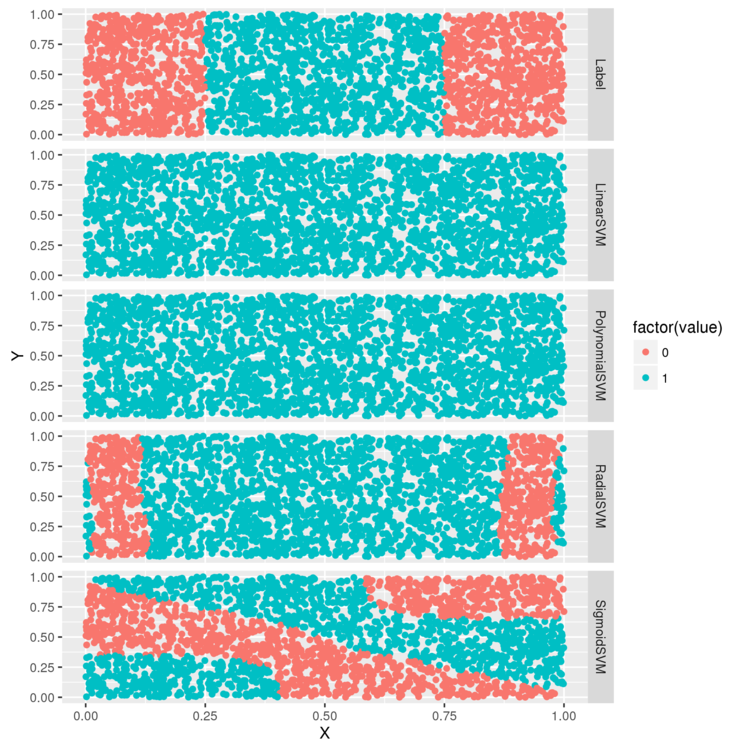
線形カーネル、多項式カーネルはロジスティック回帰と同様、うまく分類できていない感じ。 ガウスカーネルは、正解に近い境界を生成できています。
今度は、パラメータを変えたパターンを試してみます。 多項式カーネルでは、次数をパラメータとして指定できるので、3,5,10,12のパターンで判定を行ってみます。
# 次数を変更したパターン
> polynomial.degree3.svm.fit <- svm(
  Label ~ X + Y, data = df, kernel = 'polynomial', degree = 3)
> polynomial.degree5.svm.fit <- svm(
  Label ~ X + Y, data = df, kernel = 'polynomial', degree = 5)
> polynomial.degree10.svm.fit <- svm(
  Label ~ X + Y, data = df, kernel = 'polynomial', degree = 10)
> polynomial.degree12.svm.fit <- svm(
  Label ~ X + Y, data = df, kernel = 'polynomial', degree = 12)

> df <- df[, c('X', 'Y', 'Label')]
> df <- cbind(df, data.frame(
  Degree3SVM = ifelse(predict(polynomial.degree3.svm.fit) > 0, 1, 0),
  Degree5SVM = ifelse(predict(polynomial.degree5.svm.fit) > 0, 1, 0),
  Degree10SVM = ifelse(predict(polynomial.degree10.svm.fit) > 0, 1, 0),
  Degree12SVM = ifelse(predict(polynomial.degree12.svm.fit) > 0, 1, 0)
))
> predictions <- melt(df, id.vars = c('X', 'Y'))
> ggplot(predictions, aes(x = X, y = Y, color = factor(value))) +
  geom_point() + facet_grid(variable ~ .)
> ggsave(filename="plot04.png")
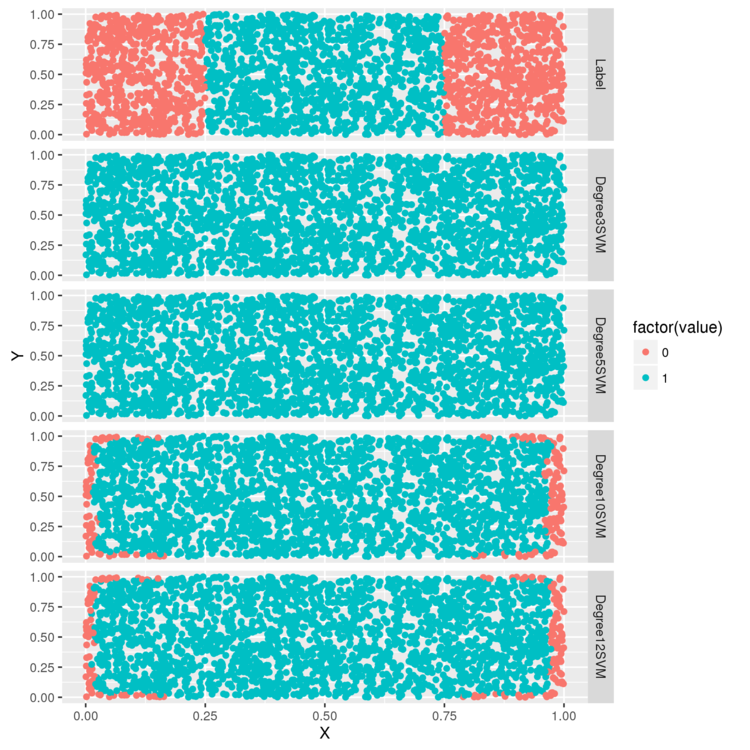
次数が3,5の場合は、指定なしの場合と変わりませんが、10,12だと少し判定できるようになっています。
次は、ガウスカーネルの cost パラメータを変えてみます。
cost は正則化の強さを示すパラメータで、値を大きくすると正則化が強く働き、訓練データに当てはまりにくくなります。
> radial.cost1.svm.fit <- svm(Label ~ X + Y, data = df, kernel = 'radial', cost = 1)
> radial.cost2.svm.fit <- svm(Label ~ X + Y, data = df, kernel = 'radial', cost = 2)
> radial.cost3.svm.fit <- svm(Label ~ X + Y, data = df, kernel = 'radial', cost = 3)
> radial.cost4.svm.fit <- svm(Label ~ X + Y, data = df, kernel = 'radial', cost = 4)

> df <- df[, c('X', 'Y', 'Label')]
> df <- cbind(df,
            data.frame(Cost1SVM = ifelse(predict(radial.cost1.svm.fit) > 0, 1, 0),
                       Cost2SVM = ifelse(predict(radial.cost2.svm.fit) > 0, 1, 0),
                       Cost3SVM = ifelse(predict(radial.cost3.svm.fit) > 0, 1, 0),
                       Cost4SVM = ifelse(predict(radial.cost4.svm.fit) > 0, 1, 0)))

> predictions <- melt(df, id.vars = c('X', 'Y'))
> ggplot(predictions, aes(x = X, y = Y, color = factor(value))) +
  geom_point() + facet_grid(variable ~ .)
> ggsave(filename="plot05.png")
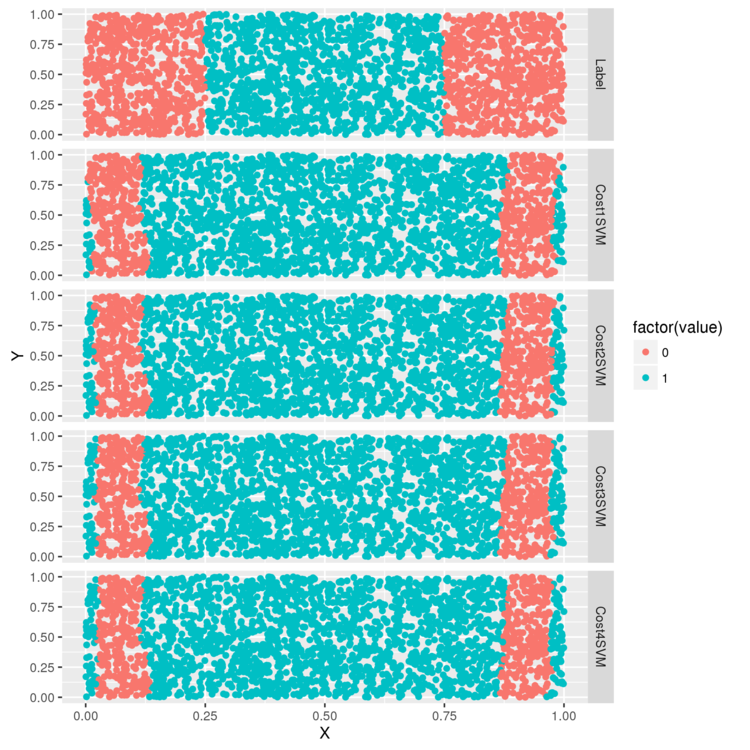
最後に、 シグモイドカーネルの gamma パラメータを試して終わり。
> sigmoid.gamma1.svm.fit <- svm(Label ~ X + Y, data = df, kernel = 'sigmoid', gamma = 1)
> sigmoid.gamma2.svm.fit <- svm(Label ~ X + Y, data = df, kernel = 'sigmoid', gamma = 2)
> sigmoid.gamma3.svm.fit <- svm(Label ~ X + Y, data = df, kernel = 'sigmoid', gamma = 3)
> sigmoid.gamma4.svm.fit <- svm(Label ~ X + Y, data = df, kernel = 'sigmoid', gamma = 4)


> df <- df[, c('X', 'Y', 'Label')]
> df <- cbind(df,
            data.frame(Gamma1SVM = ifelse(predict(sigmoid.gamma1.svm.fit) > 0, 1, 0),
                       Gamma2SVM = ifelse(predict(sigmoid.gamma2.svm.fit) > 0, 1, 0),
                       Gamma3SVM = ifelse(predict(sigmoid.gamma3.svm.fit) > 0, 1, 0),
                       Gamma4SVM = ifelse(predict(sigmoid.gamma4.svm.fit) > 0, 1, 0)))

> predictions <- melt(df, id.vars = c('X', 'Y'))
> ggplot(predictions, aes(x = X, y = Y, color = factor(value))) +
  geom_point() + facet_grid(variable ~ .)
> ggsave(filename="plot06.png")
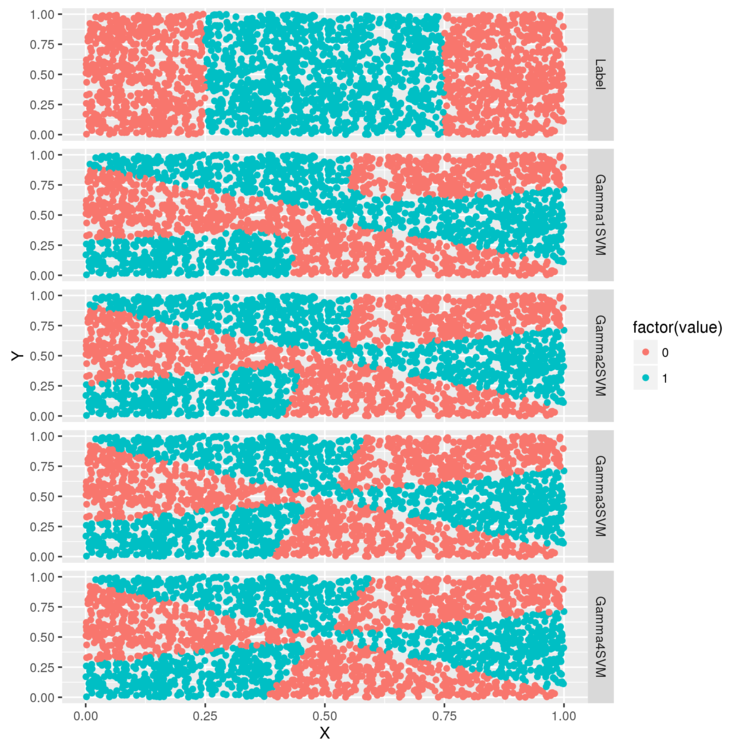
ガンマを変えると決定境界の形が変わります。(としか、書いてくれてない・・・)
アルゴリズムを比較する
SVNと、これまでに学習した、ロジスティック回帰/k近傍法を、同じデータセットに当てはめて比較してみます。
# 対象データの読み込みとクリーニング
> load(file.path('data', 'dtm.RData'))

> set.seed(1)

# 訓練データとテストデータに分割
> training.indices <- sort(sample(1:nrow(dtm), round(0.5 * nrow(dtm))))
> test.indices <- which(! 1:nrow(dtm) %in% training.indices)

> train.x <- dtm[training.indices, 3:ncol(dtm)]
> train.y <- dtm[training.indices, 1]

> test.x <- dtm[test.indices, 3:ncol(dtm)]
> test.y <- dtm[test.indices, 1]

> rm(dtm)
まずは、ロジスティック回帰。
> library('glmnet')
> regularized.logit.fit <- glmnet(train.x, train.y, family = c('binomial'))
最適な Lambda の値を、6章 と同様の手順で求めます。
> lambdas <- regularized.logit.fit$lambda
> performance <- data.frame()

> for (lambda in lambdas) {
  predictions <- predict(regularized.logit.fit, test.x, s = lambda)
  predictions <- as.numeric(predictions > 0)
  mse <- mean(predictions != test.y)
  performance <- rbind(performance, data.frame(Lambda = lambda, MSE = mse))
}

> ggplot(performance, aes(x = Lambda, y = MSE)) +
  geom_point() + scale_x_log10()
> ggsave(filename="lambda.png")
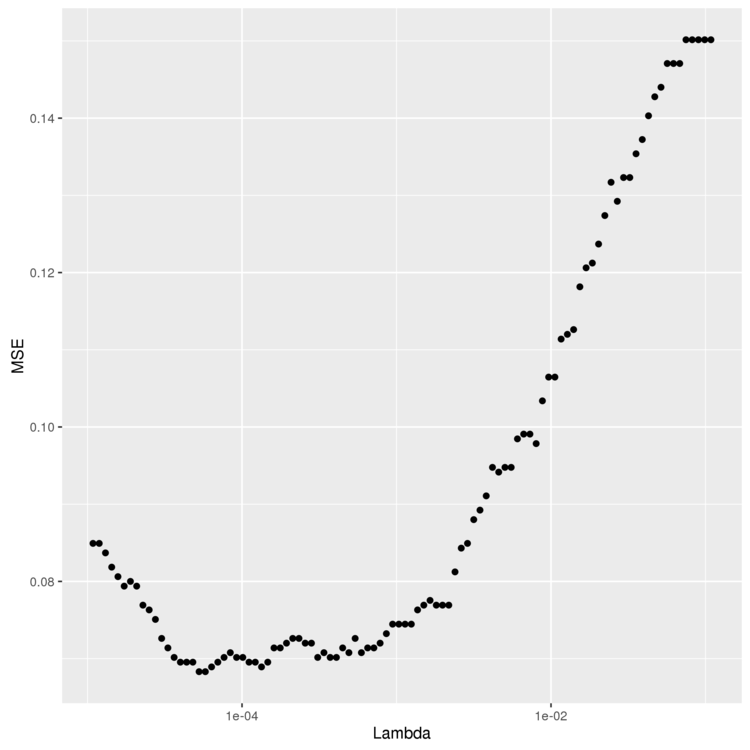
1e-03 ぐらいがよさそう。 min を使ってMSEが最小になる Lambda を計算します。
# MSEが最小になる `Lambda` を計算。
# 今回のデータだと最小になるものが2つ存在するので、max を使って大きい(=より正則化が厳しい)方を選択している
> best.lambda <- with(performance, max(Lambda[which(MSE == min(MSE))]))
Lambda が決まったので、最終的なMSEを計算します。
> mse <- with(subset(performance, Lambda == best.lambda), MSE)
[1] 0.06830769
0.06 になりました。
> library('e1071')
> linear.svm.fit <- svm(train.x, train.y, kernel = 'linear')

> predictions <- predict(linear.svm.fit, test.x)
> predictions <- as.numeric(predictions > 0)
>
> mse <- mean(predictions != test.y)
> mse
[1] 0.128
0.12 で、ロジスティックス回帰よりも悪い結果になりました。
> linear.svm.fit <- svm(train.x, train.y, kernel = 'radial')

> predictions <- predict(linear.svm.fit, test.x)
> predictions <- as.numeric(predictions > 0)

> mse <- mean(predictions != test.y)
> mse
[1] 0.1421538
今回のデータセットでは、ロジスティック回帰や、線形カーネルSVMよりも悪い結果になりました。 これは、このデータでは理想的な決定境界が線形に近い可能性を示唆しています。
最後は、k近傍法です。
> library('class')

> knn.fit <- knn(train.x, test.x, train.y, k = 50)

> predictions <- as.numeric(as.character(knn.fit))

> mse <- mean(predictions != test.y)
> mse
[1] 0.1396923
kの値を5~50で変えて、一番良い値を使うようチューニングしてみます。
> performance <- data.frame()

# 5~50でkの値を変えて試行
> for (k in seq(5, 50, by = 5)) {
  knn.fit <- knn(train.x, test.x, train.y, k = k)
  predictions <- as.numeric(as.character(knn.fit))
  mse <- mean(predictions != test.y)
  performance <- rbind(performance, data.frame(K = k, MSE = mse))
}

# もっと良いkの値を取り出す。
> best.k <- with(performance, K[which(MSE == min(MSE))])

> best.mse <- with(subset(performance, K == best.k), MSE)
> best.mse
[1] 0.09169231
チューニングの結果、0.09まで改善しました。
ということで、この問題に対してはロジスティック回帰が一番適しているという結論になりました。
以上から、得られる教訓。
- 実際のデータセットに取り組むときは、複数のアルゴリズムを試した方が良い。
- 最適なアルゴリズムは、問題の構造に依存する。
- モデルの性能は、パラメータにも依存する。良い結果を得たければパラメータの調整にも時間をかける
感想
- 回帰分析とか、最適化について、入門くらいはできたかな。
- 理論もいいけど、具体的にデータを触って、動かして学びたいプログラマ向けには悪くない本かと。(裏表紙にもそのようなコンセプトの本ですと書かれていますし)
- ただ、Amazonの書評の通り、理論的説明はあまりないので、そこは別の本が必要な感じです。
- この本の知識だけで Wikipedia とかに行くと ファッ てなります。
- 機械学習自体は面白かった。これを使って何か作りたい。
おしまい。
機械学習手習い: ソーシャルグラフの分析
「入門 機械学習」手習い、11日目。「11章 ソーシャルグラフの分析」です。
Twitterのソーシャルグラフの可視化をためし、グラフからおススメの友達を推薦するシステムを作ります。
# 前準備
> setwd("11-SNA/")
ローカルコミュニティ構造の可視化
最初の例では、ユーザー johnmyleswhite のフォロワーが、どのようなコミュニティ構造を持っているかを分析します。
ユーザー johnmyleswhite とそのユーザーが直接フォローしているユーザーのグラフ(ユーザーを中心とするエゴネットワークと呼びます)を読み込み、
各フォロワー間の距離を算出、これをもとに hclust で階層的クラスタリングを行います。
# グラフデータの読み込み
> user <- 'johnmyleswhite'
> user.ego <- read.graph("data/johnmyleswhite/johnmyleswhite_ego.graphml", format='graphml')

# ノード間の距離を算出
> user.sp <- shortest.paths(user.ego)
# 階層的クラスタリングで、フォロワーのコミュニティ構造を算出
> user.hc <- hclust(dist(user.sp))

# 可視化
> png(paste('../images/', user, '_dendrogram.png', sep=''), width=1680, height=1050)
> plot(user.hc)
> dev.off()

グラフから、ざっくりと2つの大きなコミュニティがあり、その下にさらに小さなサブコミュニティがある構成になっていることがわかるかと。
グラフデータからおススメの友達を推薦する
「友達の友達」は友達になる確率が高い、の仮定のもと、グラフデータからおススメの友達を推薦してみます。
まずは、グラフデータの読み込み。
# おススメフォロワーを推薦する対象とするユーザー名
> user <- "drewconway"


# グラフデータの読み込み
> user.graph <- suppressWarnings(read.graph(paste("data/", user, "/", user, "_net.graphml", sep = ""), format = "graphml"))
グラフから、「友達の友達」を友達候補として取り出します。 「多くの友達が友達としている候補は適性が高い」とみなして順位づけして、ソート。
# "drewconway" がフォローしているユーザー(=友達)の一覧を取り出す
> friends <- V(user.graph)$name[neighbors(user.graph, user, mode = "out") + 1]
[1] "311nyc"       "aaronkoblin"  "abumuqawama"  "acroll"       "adamlaiacano"
[6] "aeromax"

# グラフのエッジの一覧を取り出す
> user.el <- get.edgelist(user.graph)
> head(user.el)
     [,1]         [,2]
[1,] "drewconway" "311nyc"
[2,] "drewconway" "aaronkoblin"
[3,] "drewconway" "abumuqawama"
[4,] "drewconway" "acroll"
[5,] "drewconway" "adamlaiacano"
[6,] "drewconway" "aeromax"

# 友達の友達が2番目の要素(ターゲット)に含まれる行を取り出す。
# ただし、すでにフォロー済み(=友達)になっているユーザーは除く
> non.friends <- sapply(1:nrow(user.el), function(i) {
  ifelse(any(user.el[i,] == user | !user.el[i,1] %in% friends) | user.el[i,2] %in% friends, FALSE, TRUE)
})
> non.friends.el <- user.el[which(non.friends == TRUE),]
> head(non.friends.el)
     [,1]     [,2]
[1,] "000988" "1000timesyes"
[2,] "000988" "10ch"
[3,] "000988" "1mrankhan"
[4,] "000988" "1ndus"
[5,] "000988" "500startups"
[6,] "000988" "_hoffman"

# 友達候補ごとの友達の数を集計
> friends.count <- table(non.friends.el[,2])
> head(friends.count)
        ___emma   __damonwang__          __dave __davidflanagan         __iriss
              1               1               2               3               1
         __neha
              1

# データフレームに変換
> friends.followers <- data.frame(list(Twitter.Users = names(friends.count),
    Friends.Following=as.numeric(friends.count)), stringsAsFactors = FALSE)
> head(friends.followers)
    Twitter.Users Friends.Following
1         ___emma                 1
2   __damonwang__                 1
3          __dave                 2
4 __davidflanagan                 3
5         __iriss                 1
6          __neha                 1

# 友達候補としての最適度を示す指標として、各友達候補をフォローしている友達比率を計算して使う。
# 多くの友達が友達としている候補は適性が高いとみなす。
> friends.followers$Friends.Norm <- friends.followers$Friends.Following / length(friends)
> head(friends.followers)
    Twitter.Users Friends.Following Friends.Norm
1         ___emma                 1  0.003816794
2   __damonwang__                 1  0.003816794
3          __dave                 2  0.007633588
4 __davidflanagan                 3  0.011450382
5         __iriss                 1  0.003816794
6          __neha                 1  0.003816794

# お勧め度の指標でソート
> friends.followers <- friends.followers[with(friends.followers, order(-Friends.Norm)),]
データができたので、お勧め度順に上位6人を表示してみます。
# 上位6人を取得。
> head(friends.followers)
      Twitter.Users Friends.Following Friends.Norm
13388       cshirky                80    0.3053435
21403    fredwilson                58    0.2213740
6950        bigdata                57    0.2175573
14062    dangerroom                57    0.2175573
55153 shitmydadsays                55    0.2099237
2025           al3x                54    0.2061069
機械学習手習い: k近傍法を使ったレコメンドシステムを作る
「入門 機械学習」手習い、10日目。「10章 k近傍法:推薦システム」です。
k近傍法を使って類似度の高いデータを集める手法を学び、これを使ってRユーザーにRパッケージを推薦するシステムを作ります。
# 前準備
> setwd("10-Recommendations/")
k近傍法の概要
k近傍法は、データ間の距離を使ってデータを分類する手法です。 k近傍法であれば、以下のような、データのばらつきが多く、スパムフィルタを作るときに使った、線形決定境界での分類が難しいデータもうまく分類することができます。
> library('ggplot2')
> df <- read.csv(file.path('data', 'example_data.csv'))
> head(df)
         X        Y Label
1 2.373546 5.398106     0
2 3.183643 4.387974     0
3 2.164371 5.341120     0
4 4.595281 3.870637     0
5 3.329508 6.433024     0
6 2.179532 6.980400     0

> plot <- ggplot(df, aes(x = X, y = Y)) +
    geom_point(aes(shape = Label)) +
    scale_shape_identity()
> ggsave(plot, filename = "01.png")
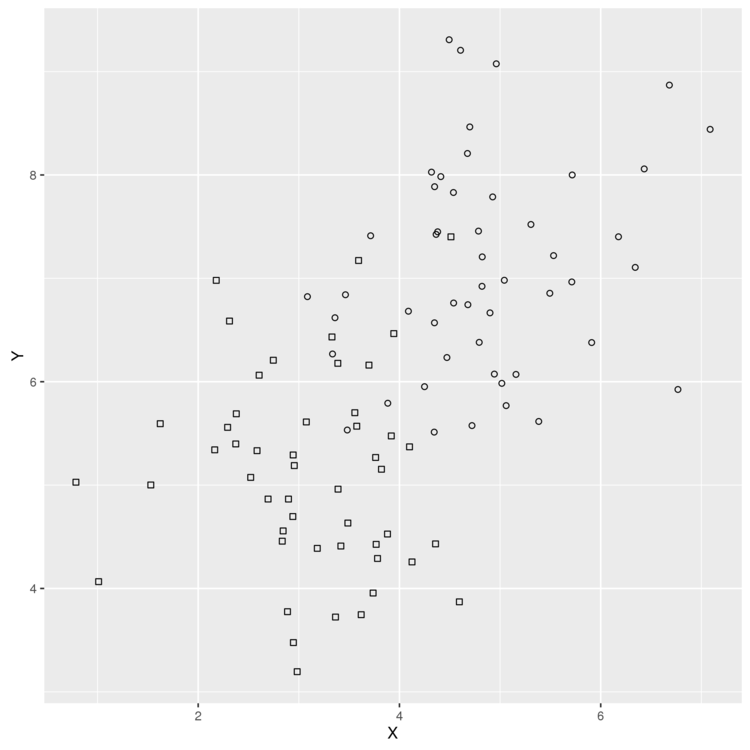
このデータからk近傍法を使って、ある点のデータのLabelを予測してみます。 まずは、各点ごとのユークリッド距離を計算する関数を用意。
# データフレーム内の各点間の距離を格納するマトリックスを作る
> distance.matrix <- function(df) {
  distance <- matrix(rep(NA, nrow(df) ^ 2), nrow = nrow(df))

  for (i in 1:nrow(df)) {
    for (j in 1:nrow(df)) {
      distance[i, j] <- sqrt((df[i, 'X'] - df[j, 'X']) ^ 2
                           + (df[i, 'Y'] - df[j, 'Y']) ^ 2)
    }
  }

  return(distance)
}
特定の点から最も近い点をk個返す関数を作ります。
# distanceのiの位置にある点に最も近い点をk個返す。
k.nearest.neighbors <- function(i, distance, k = 5) {
  return(order(distance[i, ])[2:(k + 1)])
}
最後に、予測を行うknn関数を定義。
> knn <- function(df, k = 5) {

  # 距離行列を計算
  distance <- distance.matrix(df)

  # 結果を格納する行列を作る
  predictions <- rep(NA, nrow(df))

  for (i in 1:nrow(df)) {
    # もっとも近い5個を取り出し、多数決でラベルの値を推測する
    indices <- k.nearest.neighbors(i, distance, k = k)
    predictions[i] <- ifelse(mean(df[indices, 'Label']) > 0.5, 1, 0)
  }
  return(predictions)
}
準備ができたので、実行して精度を評価してみます。
> df <- transform(df, kNNPredictions = knn(df))
sum(with(df, Label != kNNPredictions))
[1] 7
7つ失敗しました。データ数は100なので、精度は93%。
↑のk近傍法の実装は、実はRに用意されていたりするので、そちらを使ってみます。
> rm('knn') # 自作したknnを削除

> library('class')

> df <- read.csv(file.path('data', 'example_data.csv'))

# データの半分をランダム抽出し、一方で訓練、他方で評価を行う。
> n <- nrow(df)
> set.seed(1)
> indices <- sort(sample(1:n, n * (1 / 2)))
> training.x <- df[indices, 1:2]
> test.x <- df[-indices, 1:2]
> training.y <- df[indices, 3]
> test.y <- df[-indices, 3]

# 推測を実行
> predicted.y <- knn(training.x, test.x, training.y, k = 5)

> sum(predicted.y != test.y)
[1] 7
7つ失敗。データ数は50なので、86%の精度です。
比較のため、ロジスティック回帰での推測も行ってみます。
> logit.model <- glm(Label ~ X + Y, data = df[indices, ])
> predictions <- as.numeric(predict(logit.model, newdata = df[-indices, ]) > 0)
> sum(predictions != test.y)
[1] 16
こちらは16個失敗で、精度は68%。このような線形分類が難しいデータの場合、k近傍法は線形分類器よりうまく動作します。
Rパッケージのレコメンドシステムを作る
概要がつかめたところで、k近傍法を使ってRユーザーにお勧めのRパッケージをレコメンドするシステムを作ります。
具体的には、ユーザーがインストールしているパッケージ情報から、それと似たパッケージを探して推薦するアイテムベースのレコメンドを行います。
まずはパッケージデータの読み込み。
> installations <- read.csv(file.path('data', 'installations.csv'))
> head(installations)
             Package User Installed
1              abind    1         1
2 AcceptanceSampling    1         0
3             ACCLMA    1         0
4           accuracy    1         1
5            acepack    1         0
6        aCGH.Spline    1         0
Installed が 1のものがユーザーがインストールしているパッケージを示します。
まずはこのデータを「パッケージ x ユーザー」の行列に変換します。
> library('reshape')
> user.package.matrix <- cast(installations, User ~ Package, value = 'Installed')
> user.package.matrix[, 1]
> row.names(user.package.matrix) <- user.package.matrix[, 1]
> user.package.matrix <- user.package.matrix[, -1]
> head(user.package.matrix[1:6, 1:6])
  abind AcceptanceSampling ACCLMA accuracy acepack aCGH.Spline
1     1                  0      0        1       0           0
3     1                  1      0        1       1           1
4     0                  1      1        1       1           0
5     1                  1      1        0       1           0
6     1                  1      1        0       1           0
7     1                  1      1        0       1           1
この行列を引数に cor を実行し、各列の相関係数を計算します。
今回は、これを類似度を測る指標として使います。
> similarities <- cor(user.package.matrix)
> similarities[1:6, 1:6]
            [,1]        [,2]        [,3]         [,4]         [,5]         [,6]
[1,]  1.00000000 -0.04822428 -0.19485928 -0.074935401  0.111369209  0.114616917
[2,] -0.04822428  1.00000000  0.32940392 -0.152710227 -0.151554446 -0.129640745
[3,] -0.19485928  0.32940392  1.00000000 -0.194859284  0.129323382  0.068326672
[4,] -0.07493540 -0.15271023 -0.19485928  1.000000000 -0.129930744  0.006251832
[5,]  0.11136921 -0.15155445  0.12932338 -0.129930744  1.000000000  0.007484812
[6,]  0.11461692 -0.12964074  0.06832667  0.006251832  0.007484812  1.000000000
相関係数は1~-1の数値なので、これを、1が距離ゼロ(最も近い)、-1が距離無限大(最も遠い)になるように変換します。
> distances <- -log((similarities / 2) + 0.5)
          [,1]      [,2]      [,3]      [,4]      [,5]      [,6]
[1,] 0.0000000 0.7425730 0.9098854 0.7710389 0.5875544 0.5846364
[2,] 0.7425730 0.0000000 0.4084165 0.8588597 0.8574965 0.8319964
[3,] 0.9098854 0.4084165 0.0000000 0.9098854 0.5715285 0.6270536
[4,] 0.7710389 0.8588597 0.9098854 0.0000000 0.8323296 0.6869148
[5,] 0.5875544 0.8574965 0.5715285 0.8323296 0.0000000 0.6856902
[6,] 0.5846364 0.8319964 0.6270536 0.6869148 0.6856902 0.0000000
データができたので、k近傍のパッケージを取り出して、パッケージのインストール確率を算出する関数を書きます。
# distanceのiの位置にある点に最も近い点をk個返す。
> k.nearest.neighbors <- function(i, distances, k = 25) {
  return(order(distances[i, ])[2:(k + 1)])
}

# 指定ユーザーが指定したパッケージをインストールしている確率を計算する
> installation.probability <- function(user, package, user.package.matrix, distances, k = 25){
  # 近くのパッケージを取得
  neighbors <- k.nearest.neighbors(package, distances, k = k)
  # 近隣パッケージのインストール率の平均をパッケージのインストール率として返す。
  return(mean(sapply(neighbors, function (neighbor) {user.package.matrix[user, neighbor]})))
}
動作確認。ユーザー1が1つめのパッケージをインストールする確率は76%。
> installation.probability(1, 1, user.package.matrix, distances)
[1] 0.76
あとは、すべてのパッケージのインストール確率を算出し、確率上位のものを取り出せば、レコメンドエンジンの出来上がり。
# 全パッケージのインストール確率を計算し、高い順にソートして返す。
> most.probable.packages <- function(user, user.package.matrix, distances, k = 25){
  return(order(sapply(1:ncol(user.package.matrix), function (package) {
     installation.probability(user, package, user.package.matrix, distances, k = k)
  }), decreasing = TRUE))
}
実行してみます。
# インストール確率順にソートしたパッケージ一覧を取得
> listing = most.probable.packages(1, user.package.matrix, distances)
# 上位5件のパッケージ名を表示
> colnames(user.package.matrix)[listing[1:5]]
> colnames(user.package.matrix)[listing[1:5]]
[1] "adegenet"            "AIGIS"               "ConvergenceConcepts"
[4] "corcounts"           "DBI"
機械学習手習い: クラスタリング
「入門 機械学習」手習い、9日目。「9章 MDS:米国上院議員の類似度の視覚的な調査」です。
観測値をクラスタリングするための、多次元尺度構成法(MDS:multidimensional scaling)を学び、得票に基づいて米国上院議員をクラスタリングしてみます。
# 前準備
> setwd("09-MDS/")
多次元尺度構成法でのクラスタリング
最初に、顧客の製品評価データを使って顧客を分類する例を試し、多次元尺度構成法の考え方を学びます。
まずは、製品評価データを作成します。
> set.seed(851982)
> ex.matrix <- matrix(sample(c(-1, 0, 1), 24, replace = TRUE), nrow = 4, ncol = 6)
> row.names(ex.matrix) <- c('A', 'B', 'C', 'D')
> colnames(ex.matrix) <- c('P1', 'P2', 'P3', 'P4', 'P5', 'P6')
> ex.matrix
  P1 P2 P3 P4 P5 P6
A  0 -1  0 -1  0  0
B -1  0  1  1  1  0
C  0  0  0  1 -1  1
D  1  0  1 -1  0  0
列(P1,P2..)が製品、行(A,B)が顧客を示します。値が評価値で、1が良い、-1が悪い、0が未評価を意味します。
評価値はsampleを使ってランダムに生成しています。
このデータから顧客同士の関係を取り出すため、これを関係を要約する数値に変換する必要があります。 具体的には、以下のような手順で、顧客同士の意見の一致度を示す行列にします。
- 1) 各製品に対するAさんの評価、Bさんの評価を比較し、算出された数値を合計
- 両方とも1 or -1 なら、意見が一致(+1)
- 片方が1で、もう一方が-1の場合、意見は不一致(-1)
- いずれか一方が0の場合、未評価(0)
- 2) この評価を全ユーザーの組み合わせで行い、行列を作る。
例) AさんとBさんの一致度
一致度 = 製品1の一致度 + 製品2の一致度 + 製品3の一致度 + 製品4の一致度 + 製品5の一致度 + 製品6の一致度
       = (0 * -1) + (-1 * 0) + (0 * 1) + (-1 * 1) + (0 * 1) + (0 * 0)
       = -1
この操作は、行列を転置して掛け合わせることでさくっと計算できます。
> ex.mult <- ex.matrix %*% t(ex.matrix)
> ex.mult
   A  B  C  D
A  2 -1 -1  1
B -1  4  0 -1
C -1  0  3 -1
D  1 -1 -1  3
各値が、↑で説明した意見の一致度を示す数値になります。 ちなみに、AxAやBxBの場合、意見は完全一致なので、高い値になります。
次に、このデータが示す顧客間の距離を、ユークリッド距離を計算することで数値化します。
ユークリッド距離、↑のデータを4次元座標にマッピングしたときの、各座標間の距離です。(という認識であってるのかな?)
ユークリッド距離は、 dist 関数で計算できます。
> ex.dist <- dist(ex.mult)
> ex.dist
         A        B        C
B 6.244998
C 5.477226 5.000000
D 2.236068 6.782330 6.082763
A,Dは距離が近く、意見が似ているとわかります。
最後に、この距離行列を多次元尺度構成法で可視化します。
今回使う多次元尺度構成法では、データ中のすべての点間の距離を示す距離行列を使い、その2点間の距離を近似する座標を返します。
これを使って、顧客の関係を2次元の図にしてみます。
> png("plot1.png", width = 100, height = 100)
> ex.mds <- cmdscale(ex.dist)
> plot(ex.mds, type = 'n')
> text(ex.mds, c('A', 'B', 'C', 'D'))
> dev.off()

散布図から、A,Dは類似性があることがわかります。
米国上院議員のクラスタリング
多次元尺度構成法の概要がつかめたところで、本題に取り組みます。 法案への賛成/反対データを使って、米国上院議員を分類してみます。
まずは、データの読み込みとクリーニングから。
> library('foreign')
> library('ggplot2')

> data.dir <- file.path("data", "roll_call")
> data.files <- list.files(data.dir)

# 全データを読み込む
> rollcall.data <- lapply(data.files, function(f) {
  read.dta(file.path(data.dir, f), convert.factors = FALSE)
})
今回は、議員の名前、所属政党、賛否のみ使うので、これを取り出します。
> rollcall.simplified <- function(df) {
  no.pres <- subset(df, state < 99) # state 99は副大統領。今回はこれは除外する。

  # 投票方法にはいくつかあるので、賛成(1)/反対(-1)/非投票(0)に丸める
  for(i in 10:ncol(no.pres)) {
    no.pres[,i] <- ifelse(no.pres[,i] > 6, 0, no.pres[,i])
    no.pres[,i] <- ifelse(no.pres[,i] > 0 & no.pres[,i] < 4, 1, no.pres[,i])
    no.pres[,i] <- ifelse(no.pres[,i] > 1, -1, no.pres[,i])
  }

  return(as.matrix(no.pres[,10:ncol(no.pres)]))
}

> rollcall.simple <- lapply(rollcall.data, rollcall.simplified)
元データができたので、距離行列を作成。
> rollcall.dist <- lapply(rollcall.simple, function(m) dist(m %*% t(m)))
MDSを計算。
# 図にした時の配置を直観に合わせるため、-1を掛けて反転させてます。
> rollcall.mds <- lapply(rollcall.dist,
  function(d) as.data.frame((cmdscale(d, k = 2)) * -1))
> head(rollcall.mds[[1]])
          V1       V2
2  -11.44068 293.0001
3  283.82580 132.4369
4  885.85564 430.3451
5 1714.21327 185.5262
6 -843.58421 220.1038
7 1594.50998 225.8166
さらに、 rollcall.data から、議員名と所属政党を取り出して追加します。
> congresses <- 101:111
> for(i in 1:length(rollcall.mds)) {
  names(rollcall.mds[[i]]) <- c("x", "y")

  congress <- subset(rollcall.data[[i]], state < 99) # 副大統領は除外
  # 議員名を取り出す。姓名が含まれている場合があるので、名だけを取り出す。
  congress.names <- sapply(as.character(congress$name),
    function(n) strsplit(n, "[, ]")[[1]][1])

  rollcall.mds[[i]] <- transform(rollcall.mds[[i]],
                                 name = congress.names,
                                 party = as.factor(congress$party),
                                 congress = congresses[i])
}
> head(rollcall.mds[[1]])
           x        y      name party congress
2  -11.44068 293.0001    SHELBY   100      101
3  283.82580 132.4369    HEFLIN   100      101
4  885.85564 430.3451   STEVENS   200      101
5 1714.21327 185.5262 MURKOWSKI   200      101
6 -843.58421 220.1038 DECONCINI   100      101
7 1594.50998 225.8166    MCCAIN   200      101
データができたので、グラフにしてみます。 まずは、第110上院議会の散布図。
> cong.110 <- rollcall.mds[[9]]
> base.110 <- ggplot(cong.110, aes(x = x, y = y)) +
  scale_size(range = c(2,2), guide = 'none') +
  scale_alpha(guide = 'none') +
  theme_bw() +
  theme(axis.ticks = element_blank(),
        axis.text.x = element_blank(),
        axis.text.y = element_blank(),
        panel.grid.major = element_blank()) +
  ggtitle("Roll Call Vote MDS Clustering for 110th U.S. Senate") +
  xlab("") +
  ylab("") +
  scale_shape(name = "Party", breaks = c("100", "200", "328"),
              labels = c("Dem.", "Rep.", "Ind."), solid = FALSE) +
  scale_color_manual(name = "Party", values = c("100" = "black",
                                                "200" = "dimgray",
                                                "328"="grey"),
                     breaks = c("100", "200", "328"),
                     labels = c("Dem.", "Rep.", "Ind.")) +
  geom_point(aes(shape = party, alpha = 0.75, size = 2))
> ggsave(plot = base.110, filename = 'plot2.png')

所属政党でざっくり二分される結果に。まぁ、そうですよね。
最後に、残りの議会の図も作成して終わり。
> all.mds <- do.call(rbind, rollcall.mds)
> all.plot <- ggplot(all.mds, aes(x = x, y = y)) +
  geom_point(aes(shape = party, alpha = 0.75, size = 2)) +
  scale_size(range = c(2, 2), guide = 'none') +
  scale_alpha(guide = 'none') +
  theme_bw() +
  theme(axis.ticks = element_blank(),
        axis.text.x = element_blank(),
        axis.text.y = element_blank(),
        panel.grid.major = element_blank()) +
  ggtitle("Roll Call Vote MDS Clustering for U.S. Senate (101st - 111th Congress)") +
       xlab("") +
       ylab("") +
       scale_shape(name = "Party",
                   breaks = c("100", "200", "328"),
                   labels = c("Dem.", "Rep.", "Ind."),
                   solid = FALSE) +
      facet_wrap(~ congress)
> ggsave(plot = all.plot, filename = 'plot3.png')

機械学習手習い: 主成分分析を使った株価指標の作成
「入門 機械学習」手習い、8日目。「8章 PCA:株式市場指標の作成」です。
PCA(principal components analysis)とは、日本語で主成分分析のことで、 多数のデータを「縮約」して、傾向を表す少数の指標を作成することを指します。 今回は、主成分分析を使って、複数銘柄の株価データから、全体の傾向を要約した株価指標を作成してみます。
前準備とデータの読み込み
株価データを読み込み。
> setwd("08-PCA")
> library('ggplot2')

> prices <- read.csv(file.path('data', 'stock_prices.csv'),
  stringsAsFactors = FALSE)
> head(prices)
        Date Stock Close
1 2011-05-25   DTE 51.12
2 2011-05-24   DTE 51.51
3 2011-05-23   DTE 51.47
4 2011-05-20   DTE 51.90
5 2011-05-19   DTE 51.91
6 2011-05-18   DTE 51.68
日付が文字列になっているので、日付オブジェクトに変換します。
> library('lubridate')
> prices <- transform(prices, Date = ymd(Date))
銘柄間の相関を確認する
主成分分析では、各データごとの相関が強いときに効果が大きくなります。
まずは、各データの相関を確認します。
> library('reshape')

# 一部データに欠落があるので、除外
> prices <- subset(prices, Date != ymd('2002-02-01'))
> prices <- subset(prices, Stock != 'DDR')

# 日付を行、銘柄を列とするマトリックスに変換
> date.stock.matrix <- cast(prices, Date ~ Stock, value = 'Close')
> head(date.stock.matrix)
        Date   ADC   AFL ARKR  AZPN CLFD   DTE  ENDP  FLWS    FR GMXR   GPC
1 2002-01-02 17.70 23.78 8.15 17.10 3.19 42.37 11.54 15.77 31.16 4.50 36.09
2 2002-01-03 16.14 23.52 8.15 17.41 3.27 42.14 11.48 17.40 31.45 4.37 35.90
3 2002-01-04 15.45 23.92 7.79 17.90 3.28 41.79 11.60 17.11 31.46 4.45 35.60
4 2002-01-07 16.59 23.12 7.79 17.49 3.50 41.48 11.90 17.38 31.10 4.38 35.83
5 2002-01-08 16.76 25.54 7.35 17.89 4.24 40.69 12.41 14.62 31.40 4.30 36.00
6 2002-01-09 16.78 26.30 7.40 18.25 4.25 40.81 12.27 14.27 31.05 4.25 36.20
     HE ISSC  ISSI   KSS  MTSC   NWN  ODFL PARL RELV SIGM   STT TRIB   UTR
1 40.41 7.82 12.78 70.23 10.03 26.20 13.40 1.92 1.30 1.75 52.11 1.50 39.34
2 40.53 7.29 13.40 69.65 10.85 26.25 13.00 1.94 1.22 2.11 52.90 1.55 39.49
3 40.54 6.90 14.16 70.21 10.34 26.46 13.00 1.98 1.26 2.20 54.16 1.54 39.38
4 40.25 6.30 13.81 70.17  9.99 26.84 13.32 1.94 1.28 2.11 55.14 1.55 38.55
5 39.88 6.83 14.05 69.90 10.35 27.35 13.75 1.94 1.27 2.25 54.44 1.58 38.98
6 39.90 7.00 14.15 69.01 10.15 26.15 13.74 1.97 1.28 2.16 54.92 1.64 39.60
Date列を除いた、他のすべての列の相関係数を総当たりで算出。
# Date列を除いた、他のすべての列の相関係数を総当たりで算出。
> cor.matrix <- cor(date.stock.matrix[, 2:ncol(date.stock.matrix)])
# マトリックスになっているので、数値のベクトルに変換
> correlations <- as.numeric(cor.matrix)

# ヒストグラムを描く
> ggplot(data.frame(Correlation = correlations),
  aes(x = Correlation, fill = 1)) +
  geom_density() + theme(legend.position = 'none')
> ggsave(filename="histogram.png")
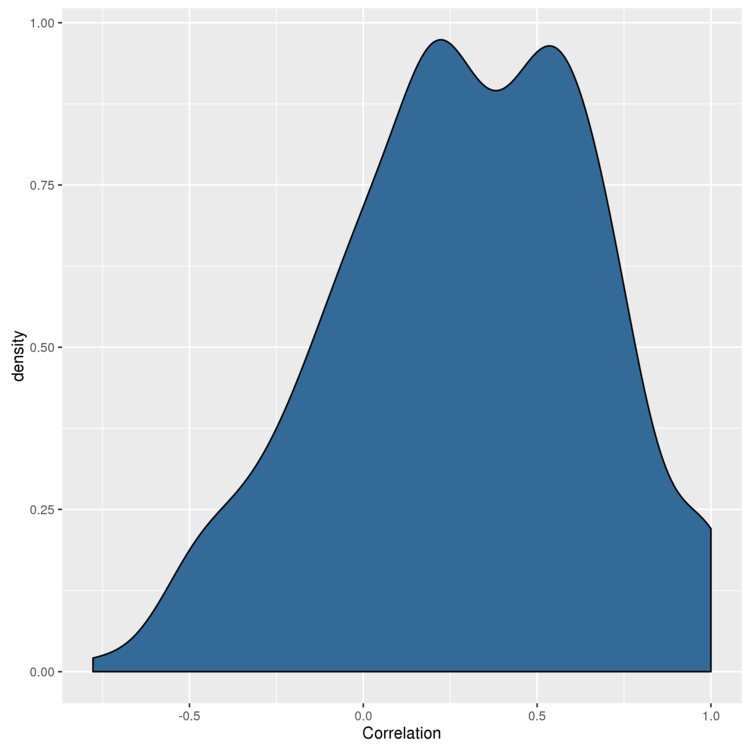
ピークは正の値になっているので、主成分分析はうまくいきそうです。
主成分分析を行う
Rでは princomp 関数で主成分分析が行えます。
> pca <- princomp(date.stock.matrix[, 2:ncol(date.stock.matrix)])
> pca
Call:
princomp(x = date.stock.matrix[, 2:ncol(date.stock.matrix)])

Standard deviations:
    Comp.1     Comp.2     Comp.3     Comp.4     Comp.5     Comp.6     Comp.7
29.1001249 20.4403404 12.6726924 11.4636450  8.4963820  8.1969345  5.5438308
    Comp.8     Comp.9    Comp.10    Comp.11    Comp.12    Comp.13    Comp.14
 5.1300931  4.7786752  4.2575099  3.3050931  2.6197715  2.4986181  2.1746125
   Comp.15    Comp.16    Comp.17    Comp.18    Comp.19    Comp.20    Comp.21
 1.9469475  1.8706240  1.6984043  1.6344116  1.2327471  1.1280913  0.9877634
   Comp.22    Comp.23    Comp.24
 0.8583681  0.7390626  0.4347983

 24  variables and  2366 observations.
> summary(pca)
Importance of components:
                           Comp.1     Comp.2      Comp.3      Comp.4     Comp.5
Standard deviation     29.1001249 20.4403404 12.67269243 11.46364500 8.49638196
Proportion of Variance  0.4600083  0.2269615  0.08723961  0.07138737 0.03921426
Cumulative Proportion   0.4600083  0.6869698  0.77420941  0.84559678 0.88481104
                           Comp.6     Comp.7     Comp.8     Comp.9     Comp.10
Standard deviation     8.19693448 5.54383078 5.13009309 4.77867520 4.257509927
Proportion of Variance 0.03649882 0.01669536 0.01429639 0.01240483 0.009846622
Cumulative Proportion  0.92130986 0.93800523 0.95230162 0.96470645 0.974553074
                           Comp.11     Comp.12     Comp.13     Comp.14
Standard deviation     3.305093119 2.619771465 2.498618085 2.174612539
Proportion of Variance 0.005933943 0.003728231 0.003391374 0.002568856
Cumulative Proportion  0.980487017 0.984215247 0.987606622 0.990175477
                           Comp.15     Comp.16     Comp.17     Comp.18
Standard deviation     1.946947496 1.870623998 1.698404287 1.634411605
Proportion of Variance 0.002059133 0.001900855 0.001566961 0.001451105
Cumulative Proportion  0.992234610 0.994135465 0.995702426 0.997153531
                           Comp.19      Comp.20      Comp.21      Comp.22
Standard deviation     1.232747064 1.1280913254 0.9877633997 0.8583681320
Proportion of Variance 0.000825513 0.0006912967 0.0005300072 0.0004002424
Cumulative Proportion  0.997979044 0.9986703406 0.9992003478 0.9996005903
                            Comp.23      Comp.24
Standard deviation     0.7390625523 0.4347982692
Proportion of Variance 0.0002967142 0.0001026955
Cumulative Proportion  0.9998973045 1.0000000000
Comp.1 Comp.2 ... が主成分で、寄与率(Proportion of Variance) が、その主成分でデータ全体のどの程度を説明できているかを示します。累積寄与率(Cumulative Proportion) は、寄与率を蓄積した値で、↑の場合なら Comp.1,Comp.2を使うと、データの68.6%を説明できます。
第一主成分(Comp1)がどのようにできているかは、loadingsで負荷を取り出すことで調べることができます。
> principal.component <- pca$loadings[, 1]
> principal.component
         ADC          AFL         ARKR         AZPN         CLFD          DTE
-0.160756643 -0.269577636 -0.313489533 -0.071623993  0.012445236 -0.085272822
        ENDP         FLWS           FR         GMXR          GPC           HE
-0.185242688 -0.018440018 -0.270140267 -0.448622161 -0.169911152  0.132789793
        ISSC         ISSI          KSS         MTSC          NWN         ODFL
-0.139360089  0.007478053 -0.041249777 -0.309455606 -0.126452792 -0.040702588
        PARL         RELV         SIGM          STT         TRIB          UTR
-0.126541135 -0.080583114 -0.271218212 -0.366492421 -0.076298673 -0.253900525
元データの各列の値に↑の負荷を掛けて合計した値が、第一主成分です。
第一主成分で要約した値を算出する
今回は、第一主成分のみを使うことにします。
predictを使って、第一主成分でデータを要約したものを生成します。
> market.index <- predict(pca)[, 1]
> head(market.index)
[1] 30.11593 29.87794 29.68801 29.77801 28.97101 28.73909
ダウ平均株価と比較してみる
第一主成分で要約した値を、ダウ平均株価と比較してみます。
#ダウ平均株価を読み込み
> dji.prices <- read.csv(file.path('data', 'DJI.csv'), stringsAsFactors = FALSE)
> dji.prices <- transform(dji.prices, Date = ymd(Date))

# 分析対象外のデータが含まれているので除外
> dji.prices <- subset(dji.prices, Date > ymd('2001-12-31'))
> dji.prices <- subset(dji.prices, Date != ymd('2002-02-01'))
> head(dji.prices)
        Date     Open     High      Low    Close     Volume Adj.Close
1 2011-05-25 12355.45 12462.28 12271.90 12394.66 4109670000  12394.66
2 2011-05-24 12381.87 12465.80 12315.42 12356.21 3846250000  12356.21
3 2011-05-23 12511.29 12511.29 12292.49 12381.26 3255580000  12381.26
4 2011-05-20 12604.64 12630.11 12453.96 12512.04 4066020000  12512.04
5 2011-05-19 12561.46 12673.78 12506.67 12605.32 3626110000  12605.32
6 2011-05-18 12471.78 12595.60 12402.15 12560.18 3922030000  12560.18

# 日付と終値を抽出して、すべてのデータをデータフレームに統合
> dji <- with(dji.prices, rev(Close))
> dates <- with(dji.prices, rev(Date))
> comparison <- data.frame(Date = dates,
    MarketIndex = market.index, DJI = dji)
> head(comparison)
        Date MarketIndex      DJI
1 2002-01-02    30.11593 10073.40
2 2002-01-03    29.87794 10172.14
3 2002-01-04    29.68801 10259.74
4 2002-01-07    29.77801 10197.05
5 2002-01-08    28.97101 10150.55
6 2002-01-09    28.73909 10094.09
図にしてみます。
> ggplot(comparison, aes(x = MarketIndex, y = DJI)) +
  geom_point() + geom_smooth(method = 'lm', se = FALSE)
> ggsave(filename="plot.png")
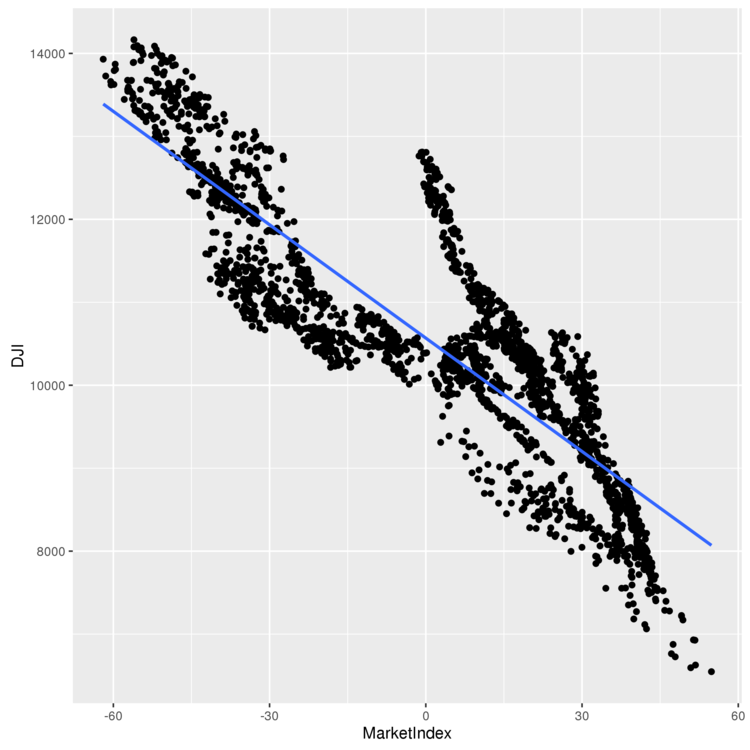
相関関係が見て取れるので、うまく要約できている感じです。
時間軸上で図にしてみてみる
最後に、作成した指標と、ダウ平均株価を時間軸上で並べて比較してみます。
# 指標の単位を合わせて比較しやすくする。また、正の相関になるように指標を調整
> comparison <- transform(comparison, MarketIndex = scale(MarketIndex)*-1)
> comparison <- transform(comparison, DJI = scale(DJI))
> head(comparison)
        Date MarketIndex        DJI
1 2002-01-02  -1.0346886 -0.3251888
2 2002-01-03  -1.0265119 -0.2602872
3 2002-01-04  -1.0199864 -0.2027079
4 2002-01-07  -1.0230787 -0.2439139
5 2002-01-08  -0.9953525 -0.2744783
6 2002-01-09  -0.9873846 -0.3115893

> alt.comparison <- melt(comparison, id.vars = 'Date')
> names(alt.comparison) <- c('Date', 'Index', 'Price')
> ggplot(alt.comparison, aes(x = Date, y = Price, group = Index, color = Index)) +
  geom_point() + geom_line()
> ggsave(filename="plot2.png")
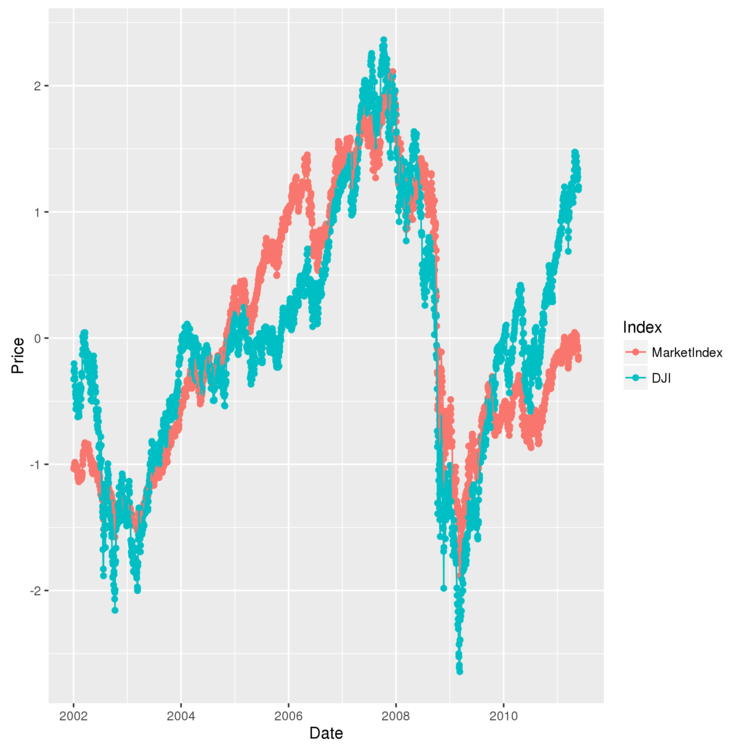
まぁ、こんなもんですかね。
機械学習手習い: 暗号解読
「入門 機械学習」手習い、7日目。「7章 最適化:暗号解読」です。
最適化について学び、それを使ってシーザー暗号を解読するシステムを作ります。
# 前準備
>  setwd("07-Optimization/")
最適化とは
最適化とは、設定で動作を変更できる機械と、その機械がうまく動作しているかを計測する指標があるときに、もっともうまく動作する設定を見つけることです。
実は、5章 回帰分析 で、身長から体重を推測する関数を作る際に、最適な切片と傾きを求めるため最適化が使われています。分析で使用した lm 関数が、内部で誤差関数と最適化アルゴリズムを使い、最適な切片と傾きを算出してくれていました。
> heights.weights <- read.csv(file.path('data', '01_heights_weights_genders.csv'))

> coef(lm(Weight ~ Height, data = heights.weights))
(Intercept)      Height
-350.737192    7.717288
lmは二乗誤差を誤差関数として使用しています。Rのコードにすると以下のような処理になります。
> squared.error <- function(heights.weights, a, b) {
  predictions <- with(heights.weights, height.to.weight(Height, a, b))
  errors <- with(heights.weights, Weight - predictions)
  return(sum(errors ^ 2))
}
切片と傾きそれぞれで、1,0,-1のパターンで、二乗誤差を出力してみます。
> height.to.weight <- function(height, a, b) {
  return(a + b * height)
}
> for (a in seq(-1, 1, by = 1)) {
  for (b in seq(-1, 1, by = 1)) {
    cat(a, b, squared.error(heights.weights, a, b), "\n")
  }
}
-1 -1 536271759
-1 0 274177183
-1 1 100471706
0 -1 531705601
0 0 270938376
0 1 98560250
1 -1 527159442
1 0 267719569
1 1 96668794
a,bの値を変えることで、二乗誤差が変動しています。 最適化問題は、誤差関数(目的関数)の結果がなるべく最小、または最大になるようなパラメータを探す問題です。
optimを使ってみる
Rでは、さまざまなアルゴリズムで最適化問題を解いてくれる便利な関数 optim が提供されているので、これを使ってみます。
# 身長から体重を推測する関数の最適値を探す例
> optim(c(0, 0), function (x) {
    squared.error(heights.weights, x[1], x[2])
})
$par
[1] -350.786736    7.718158

$value
[1] 1492936

$counts
function gradient
     111       NA

$convergence
[1] 0

$message
NULL
引数で、最適化するパラメータの開始点と、パラメータを使って値を計算する関数を指定します。
実行すると、$par の値として、パラメータの最適値が出力されます。
optimでリッジ回帰問題を解いてみる
optim の使い方がわかったので、これを使ってリッジ回帰問題を解いてみます。
リッジ回帰とは、正則化を取り入れた特殊な種類の関数で、通常の最小二乗回帰と誤差関数が違うものらしい。
まずは、リッジ誤差関数を定義。
> ridge.error <- function(heights.weights, a, b, lambda) {
  predictions <- with(heights.weights, height.to.weight(Height, a, b))
  errors <- with(heights.weights, Weight - predictions)
  return(sum(errors ^ 2) + lambda * (a ^ 2 + b ^ 2))
}
optim で解きます。
# 本来は交差検定で求めるもの。簡略化のため、今回は1が最適とわかっていると仮定して計算。
> lambda <- 1
> optim(c(0, 0), function (x) {
  ridge.error(heights.weights, x[1], x[2], lambda)
})
$par
[1] -340.434108    7.562524

$value
[1] 1612443

$counts
function gradient
     115       NA

$convergence
[1] 0

$message
NULL
解けました。
暗号解読
最適化問題のケーススタディとして、メトロポリス法というアルゴリズムを使って、シーザー暗号を解きます。(optim使わないのかよ・・・。)
まずは、文字列をシーザー暗号で暗号化する関数を定義。
> english.letters <- c('a', 'b', 'c', 'd', 'e', 'f', 'g', 'h', 'i', 'j', 'k',
                     'l', 'm', 'n', 'o', 'p', 'q', 'r', 's', 't', 'u', 'v',
                     'w', 'x', 'y', 'z')

> caesar.cipher <- list()
> inverse.caesar.cipher <- list()

> for (index in 1:length(english.letters)) {
  caesar.cipher[english.letters[index]]<- english.letters[index %% 26 + 1]
  inverse.caesar.cipher[english.letters[index %% 26 + 1]] <- english.letters[index]
}

> apply.cipher.to.string <- function(string, cipher) {
  output <- ''
  for (i in 1:nchar(string)) {
    output <- paste(output, cipher[substr(string, i, i)], sep = '')
  }
  return(output)
}

# 文字列をシーザー暗号で暗号化する
> apply.cipher.to.text <- function(text, cipher) {
  output <- c()
  for (string in text) {
    output <- c(output, apply.cipher.to.string(string, cipher))
  }
  return(output)
}
動作確認。
> apply.cipher.to.text(c('sample', 'text'), caesar.cipher)
[1] "tbnqmf" "ufyu"
暗号化する関数ができたので、解読に移ります。 問題を、以下の3つのステップに分割して、考えていきます。
1. 復号結果を評価する目的関数を定義する
今回は、暗号前のテキストは意味のある英文であることを前提としています。このため、「英文らしさ」を評価する関数を作り、目的関数とします。
具体的には、単語とその出現確率を保持する語彙データベースを作成し、復号化したテキストに含まれる単語の確率を計算、それらを掛け合わせて、テキストの「英文らしさ」とします。
まずは、語彙データベースを読み込み。/use/share/dic/wordsに含まれる単語のウィキペディアでの出現頻度を集計したデータベースです。
> load(file.path('data', 'lexical_database.Rdata'))
テキストの「英文らしさ」を判定する関数を定義。
# 単語の確率を取得する
> one.gram.probability <- function(one.gram, lexical.database = list()) {
  lexical.probability <- lexical.database[[one.gram]]
  if (is.null(lexical.probability) || is.na(lexical.probability)) {
    return(.Machine$double.eps)
    # データベースに存在しない場合、非常に少ない確率を返す。
  } else {
    return(lexical.probability)
  }
}

# テキストを復号して、その英文らしさを返す
> log.probability.of.text <- function(text, cipher, lexical.database = list()) {
  log.probability <- 0.0
  for (string in text) {
    decrypted.string <- apply.cipher.to.string(string, cipher)
    log.probability <- log.probability +
      log(one.gram.probability(decrypted.string, lexical.database))
      # 浮動小数点の演算精度は有限なので、単純に掛け合わせると結果が不安定になってしまう。
      # これを防ぐため、確率の対数を取り、それを足し合わせる。
  }
  return(log.probability)
}
2. 新しい復号表候補を生成するアルゴリズムを定義する
新しい復号表は、現在の復号表の一部を、ランダムに1箇所だけ変化させて作るようにします。
# ランダムな復号表(cipher)を生成する
> generate.random.cipher <- function() {
  cipher <- list()
  inputs <- english.letters
  outputs <- english.letters[sample(1:length(english.letters), length(english.letters))]
  for (index in 1:length(english.letters)) {
    cipher[[inputs[index]]] <- outputs[index]
  }
  return(cipher)
}

# 復号表(cipher)中のinputに対応する文字を、outputに変更する
> modify.cipher <- function(cipher, input, output) {
  new.cipher <- cipher

  new.cipher[[input]] <- output
  old.output <- cipher[[input]]

  collateral.input <- names(which(sapply(
    names(cipher), function (key) {cipher[[key]]}) == output))

  new.cipher[[collateral.input]] <- old.output
  return(new.cipher)
}

# 復号表(cipher)の一部を変更した新しい復号表を生成する。
> propose.modified.cipher <- function(cipher) {
  input <- sample(names(cipher), 1)
  output <- sample(english.letters, 1)
  return(modify.cipher(cipher, input, output))
}
3. よりよい復号表に近づくためのアルゴリズムを定義する
単純に考えると、出力結果を1の関数で評価して、高い方を使えば良いように思えます。 しかし、今回のような状況では、この方法(貪欲法と呼ばれます)だと、あまりよくないルールで行き詰ってしまいやすいらしい。
このため、以下のようなルールを使います。
- 1) 復号表A,Bがあるとき、Aの確率 < Bの確率であれば、AをBで置き換える。
- 2) Aの確率 > Bの確率 であれば、時々、AをBで置き換える。
- 具体的には、「Bの確率/Aの確率」で、AをBで置き換えます。
# メトロポリタン法の1ステップを実行する
> metropolis.step <- function(text, cipher, lexical.database = list()) {
  # 新しい復号表を生成
  proposed.cipher <- propose.modified.cipher(cipher)

  # 復号表Aの確率
  lp1 <- log.probability.of.text(text, cipher, lexical.database)
  # 復号表Bの確率
  lp2 <- log.probability.of.text(text, proposed.cipher, lexical.database)

  if (lp2 > lp1) {
    # Aの確率 < Bの確率の場合、Bの復号表を使う
    return(proposed.cipher)
  } else {
    # Aの確率 > Bの確率の場合、「Bの確率/Aの確率」で、Bの復号表を使う
    a <- exp(lp2 - lp1)
    x <- runif(1)

    if (x < a) {
      return(proposed.cipher)
    } else {
      return(cipher)
    }
  }
}
解読を行う
部品がそろったので、実際に解読を行ってみます。
まずは、暗号化文字列を作成。
> decrypted.text <- c('here', 'is', 'some', 'sample', 'text')
> encrypted.text <- apply.cipher.to.text(decrypted.text, caesar.cipher)
> print(encrypted.text)
[1] "ifsf"   "jt"     "tpnf"   "tbnqmf" "ufyu"
解読を実行。
> set.seed(1)

# ランダムな復号表を作成
> cipher <- generate.random.cipher()

> results <- data.frame()

# 50000回改善ステップを実行する
> number.of.iterations <- 50000
> for (iteration in 1:number.of.iterations) {

  # 復号表の評価値を計算
  log.probability <- log.probability.of.text(
     encrypted.text, cipher, lexical.database)

  # 現在の表での復号結果
  current.decrypted.text <- paste(apply.cipher.to.text(encrypted.text,cipher), collapse = ' ')
  correct.text <- as.numeric(current.decrypted.text == paste(decrypted.text,collapse = ' '))

  # 結果をデータフレームに追加
  results <- rbind(results,
                   data.frame(Iteration = iteration,
                              LogProbability = log.probability,
                              CurrentDecryptedText = current.decrypted.text,
                              CorrectText = correct.text))

  # メトロポリタン法のステップを実行
  cipher <- metropolis.step(encrypted.text, cipher, lexical.database)
}

# 時間がかかるので待つ...
結果を確認。
> subset(results, Iteration == 1 | Iteration %% 5000 == 0 )
      Iteration LogProbability     CurrentDecryptedText CorrectText
1             1     -180.21827 lsps bk kfvs kjvhys zsrz           0
5000       5000      -67.60777 gene is same sfmpwe text           0
10000     10000      -67.60777 gene is same spmzoe text           0
15000     15000      -66.77997 gene is some scmhbe text           0
20000     20000      -70.81143 dene as some scmire text           0
25000     25000      -39.85902 gene as some simple text           0
30000     30000      -39.85902 gene as some simple text           0
35000     35000      -39.85902 gene as some simple text           0
40000     40000      -35.78443 were as some simple text           0
45000     45000      -37.01289 were is some sample text           0
50000     50000      -35.78443 were as some simple text           0
ステップを重ねるごとに、正解に近づいています。が、よく見ると、40000ステップ目の結果の方が、45000ステップ目より評価結果が高い・・。今回使用した目的関数では「英文らしさ」を確率的に評価しているだけなので、正解にたどり着いても、次のステップに進んでしまい、このような結果になります。
最後に、メトロポリス法の問題点をまとめておきます。
機械学習手習い: 多項式回帰と正則化
「入門 機械学習」手習い、6日目。「6章 正則化:テキスト回帰」です。
多項式回帰と、過学習を避けるための正則化について学び、最後に正則化を使って書籍の裏表紙の紹介文から人気順を予測します。
# 前準備
> setwd("06-Regularization/")
> library('ggplot2')
非線形データの回帰分析
世の中には、直線では関係をうまく表現できないデータがあります。 例えばこんなの。
> set.seed(1)

> x <- seq(-10, 10, by = 0.01)
> y <- 1 - x ^ 2 + rnorm(length(x), 0, 5)

> ggplot(data.frame(X = x, Y = y), aes(x = X, y = Y)) +
  geom_point() + geom_smooth(method = 'lm', se = FALSE)
> ggsave(filename = "01.png")

回帰直線も引いてみましたが、構造をうまくとらえられていなのは明らかです。
このようなデータでも、一般化加法モデルを使うと、非線形な滑らかな表現を得ることができす。
geom_smooth を引数なしで使うと、一般化加法モデルでの回帰線が出力されます。
> ggplot(data.frame(X = x, Y = y), aes(x = X, y = Y)) +
  geom_point() + geom_smooth(se = FALSE)
> ggsave(filename = "02.png")

さて、このような一見、直線には当てはめにくいデータですが、入力を変形させることで、線形回帰の前提を満たすようにすることができたりします。 ↑のデータであれば、xの2乗を使う形に変形することで、x,yの関係を単純な線形問題に変換できます。
> x.squared <- x ^ 2
> ggplot(data.frame(XSquared = x.squared, Y = y), aes(x = XSquared, y = Y)) +
  geom_point() + geom_smooth(method = 'lm', se = FALSE)
> ggsave(filename = "03.png")

変形により、回帰線がどの程度データを表現できるようになったか、R2値を比較して見ます。
> summary(lm(y ~ x))$r.squared
[1] 2.972904e-06
> summary(lm(y ~ x.squared))$r.squared
[1] 0.9705898
変形前は、ほぼ0%であったのに対して、変形後は、97%を説明できるようになっています。
多項式回帰
データから複雑な形のモデルを構築するアプローチは、多項式回帰と呼ばれます。
簡単な直線では表現できない、正弦波のデータを使って、試してみます。
> set.seed(1)
> x <- seq(0, 1, by = 0.01)
> y <- sin(2 * pi * x) + rnorm(length(x), 0, 0.1)
> df <- data.frame(X = x, Y = y)
> ggplot(df, aes(x = X, y = Y)) + geom_point()
> ggsave(filename = "04.png")
初めに、線形回帰で分析を行ってみます。
> summary(lm(Y ~ X, data = df))

Call:
lm(formula = Y ~ X, data = df)

Residuals:
     Min       1Q   Median       3Q      Max
-1.00376 -0.41253 -0.00409  0.40664  0.85874

Coefficients:
            Estimate Std. Error t value Pr(>|t|)
(Intercept)  0.94111    0.09057   10.39   <2e-16 ***
X           -1.86189    0.15648  -11.90   <2e-16 ***
---
Signif. codes:  0 ‘***’ 0.001 ‘**’ 0.01 ‘*’ 0.05 ‘.’ 0.1 ‘ ’ 1

Residual standard error: 0.4585 on 99 degrees of freedom
Multiple R-squared:  0.5885,    Adjusted R-squared:  0.5843
F-statistic: 141.6 on 1 and 99 DF,  p-value: < 2.2e-16
R2(Multiple R-squared) は0.58となっていて、60%の変動は表現できているようですが・・・
回帰線を引いてみます。
> ggplot(data.frame(X = x, Y = y), aes(x = X, y = Y)) +
  geom_point() + geom_smooth(method = 'lm', se = FALSE)
> ggsave(filename = "05.png")

右肩下がりの直線になっています。正弦波をさらにもう一周伸ばすと、破綻しますね。 やはり、直線では無理があります。
ということで、まずは、xの2乗、3乗を入力に追加してみます。
> df <- transform(df, X2 = X ^ 2)
> df <- transform(df, X3 = X ^ 3)
>
> summary(lm(Y ~ X + X2 + X3, data = df))

Call:
lm(formula = Y ~ X + X2 + X3, data = df)

Residuals:
     Min       1Q   Median       3Q      Max
-0.32331 -0.08538  0.00652  0.08320  0.20239

Coefficients:
             Estimate Std. Error t value Pr(>|t|)
(Intercept)  -0.16341    0.04425  -3.693 0.000367 ***
X            11.67844    0.38513  30.323  < 2e-16 ***
X2          -33.94179    0.89748 -37.819  < 2e-16 ***
X3           22.59349    0.58979  38.308  < 2e-16 ***
---
Signif. codes:  0 ‘***’ 0.001 ‘**’ 0.01 ‘*’ 0.05 ‘.’ 0.1 ‘ ’ 1

Residual standard error: 0.1153 on 97 degrees of freedom
Multiple R-squared:  0.9745,    Adjusted R-squared:  0.9737
F-statistic:  1235 on 3 and 97 DF,  p-value: < 2.2e-16
R2の値が、58%から97%に向上しました。
このような感じで入力データを追加していけば、精度はさらに向上するらしい。 ただし、単純にxのべき乗を追加すると、新しく追加したべき乗の行と既存の行の相関が高くなってしまい、線形回帰のアルゴリズムが正常に動作しなくなるらしい。 しかし、ここで、xの連続したべき乗のようにふるまうが、それぞれの相関がないようにしたxの変種を追加するようにすれば、この問題を回避できるらしい。
このxの変種は、直行多項式と呼ばれ、 poly 関数を使って生成できます。
# 14個のxのべき乗を使う例
> summary(lm(Y ~ poly(X, degree = 14), data = df))

Call:
lm(formula = Y ~ poly(X, degree = 14), data = df)

Residuals:
      Min        1Q    Median        3Q       Max
-0.232557 -0.042933  0.002159  0.051021  0.209959

Coefficients:
                        Estimate Std. Error t value Pr(>|t|)
(Intercept)             0.010167   0.009038   1.125   0.2638
poly(X, degree = 14)1  -5.455362   0.090827 -60.063  < 2e-16 ***
poly(X, degree = 14)2  -0.039389   0.090827  -0.434   0.6656
poly(X, degree = 14)3   4.418054   0.090827  48.642  < 2e-16 ***
poly(X, degree = 14)4  -0.047966   0.090827  -0.528   0.5988
poly(X, degree = 14)5  -0.706451   0.090827  -7.778 1.48e-11 ***
poly(X, degree = 14)6  -0.204221   0.090827  -2.248   0.0271 *
poly(X, degree = 14)7  -0.051341   0.090827  -0.565   0.5734
poly(X, degree = 14)8  -0.031001   0.090827  -0.341   0.7337
poly(X, degree = 14)9   0.077232   0.090827   0.850   0.3975
poly(X, degree = 14)10  0.048088   0.090827   0.529   0.5979
poly(X, degree = 14)11  0.129990   0.090827   1.431   0.1560
poly(X, degree = 14)12  0.024726   0.090827   0.272   0.7861
poly(X, degree = 14)13  0.023706   0.090827   0.261   0.7947
poly(X, degree = 14)14  0.087906   0.090827   0.968   0.3358
---
Signif. codes:  0 ‘***’ 0.001 ‘**’ 0.01 ‘*’ 0.05 ‘.’ 0.1 ‘ ’ 1

Residual standard error: 0.09083 on 86 degrees of freedom
Multiple R-squared:  0.986,     Adjusted R-squared:  0.9837
F-statistic: 431.7 on 14 and 86 DF,  p-value: < 2.2e-16
poly を使うことで、複雑な形を捉えることができるようになりますが、問題もあります。
これを確認するため、次数(degree)を増やしたモデルの形を出力してみます。
# 次数1
> poly.fit <- lm(Y ~ poly(X, degree = 1), data = df)
> df <- transform(df, PredictedY = predict(poly.fit))
> ggplot(df, aes(x = X, y = PredictedY)) +
  geom_point() + geom_line()
> ggsave(filename = "11.png")

# 次数3
> poly.fit <- lm(Y ~ poly(X, degree = 3), data = df)
> df <- transform(df, PredictedY = predict(poly.fit))
> ggplot(df, aes(x = X, y = PredictedY)) +
  geom_point() + geom_line()
> ggsave(filename = "12.png")

# 次数5
> poly.fit <- lm(Y ~ poly(X, degree = 5), data = df)
> df <- transform(df, PredictedY = predict(poly.fit))
> ggplot(df, aes(x = X, y = PredictedY)) +
  geom_point() + geom_line()
> ggsave(filename = "13.png")

# 次数25
> poly.fit <- lm(Y ~ poly(X, degree = 25), data = df)
> df <- transform(df, PredictedY = predict(poly.fit))
> ggplot(df, aes(x = X, y = PredictedY)) +
  geom_point() + geom_line()
> ggsave(filename = "14.png")

次数3~5では問題なさそうですが、次数25になると歪みはじめていて、元の波形を正しく表現できなくなっています。 この問題は、過学習と呼ばれます。
過学習を防ぐ
交差検定
交差検定は、データを2つに分割し、その一部を使って解析したモデルを、残りに当てはめて検証し、モデルの妥当性を検証する手法です。
交差検定を使って、次数の妥当性を検証してみます。 まずは、正弦波データを再作成。
> set.seed(1)

> x <- seq(0, 1, by = 0.01)
> y <- sin(2 * pi * x) + rnorm(length(x), 0, 0.1)
今回はデータを半分に分割して。片方を訓練データ、もう一方をテストデータとします。
今回のデータは単純に前半/後半で分割すると傾向が偏るので、sampleを使ってランダム抽出を行います。
> n <- length(x)
>
# 1~nのベクトルから、0.5 * n 個のインデックスをランダム抽出する
> indices <- sort(sample(1:n, round(0.5 * n)))

# インデックスのデータを訓練データとする
> training.x <- x[indices]
> training.y <- y[indices]

# 残りはテストデータ
> test.x <- x[-indices]
> test.y <- y[-indices]
>
> training.df <- data.frame(X = training.x, Y = training.y)
> test.df <- data.frame(X = test.x, Y = test.y)
精度は平均二乗誤差の平方根(RMSE)で確認します。RMSEを算出する関数を定義。
rmse <- function(y, h) {
  return(sqrt(mean((y - h) ^ 2)))
}
準備ができたので、1~12まで次数でモデルを作成し、検証してみます。
> performance <- data.frame()
> for (d in 1:12) {
  poly.fit <- lm(Y ~ poly(X, degree = d), data = training.df)
  performance <- rbind(performance, data.frame(Degree = d,
      Data = 'Training', RMSE = rmse(training.y, predict(poly.fit))))
  performance <- rbind(performance, data.frame(Degree = d,
      Data = 'Test',     RMSE = rmse(test.y, predict(poly.fit, newdata = test.df))))
}
> ggplot(performance, aes(x = Degree, y = RMSE, linetype = Data)) +
    geom_point() + geom_line()
> ggsave(filename = "20.png")

次数が3あたりから精度が高くなってきますが、11,12くらいになると逆に悪化してきています。 このことから、真ん中あたりの次数が妥当と判断できます。
正則化
モデルの精度と複雑さの妥協点を求めることで、過学習を防ぐアプローチもあります。
glmnet 関数を使うと、回帰に適用可能なすべての正則化セットが返されます。
Lambdaの数値が大きいほど、正則化の効果が強く(=複雑さが低く)なります。
各Lambdaごとに、精度を算出することで、妥協点を探ります。
> library('glmnet')
> glmnet.fit <- with(training.df, glmnet(poly(X, degree = 10), Y))

> lambdas <- glmnet.fit$lambda
> performance <- data.frame()

# Lambdaごとに精度(RMSE)を計算
> for (lambda in lambdas) {
  performance <- rbind(performance,
    data.frame(Lambda = lambda,
    RMSE = rmse(test.y, with(test.df, predict(glmnet.fit, poly(X, degree = 10), s = lambda)))))
}

# 結果を図示
> ggplot(performance, aes(x = Lambda, y = RMSE)) +
  geom_point() + geom_line()
> ggsave(filename = "21.png")

0.5あたりで、RMSEが最小となり、精度が一番高くなっているのがわかります。
テキスト回帰
多項式回帰と正則化の利用例として、オライリーが出版した書籍の売り上げトップ100冊の相対的な人気度を、 裏表紙の紹介文に含まれる単語から推定してみます。
単語を入力値とするようなテキスト回帰では、データの行より列の方が多く、正則化なしの線形回帰では常に過学習したモデルが生成されるらしい。 このため、何らかの正則化をする必要があるらしい。
まずはデータを読み込んで、文書単語行列を作ります。
> ranks <- read.csv(file.path('data', 'oreilly.csv'),
                  stringsAsFactors = FALSE)
> library('tm')

> documents <- data.frame(Text = ranks$Long.Desc.)
> row.names(documents) <- 1:nrow(documents)
>
> corpus <- Corpus(DataframeSource(documents))
> corpus <- tm_map(corpus, content_transformer(tolower))
> corpus <- tm_map(corpus, stripWhitespace)
> corpus <- tm_map(corpus, removeWords, stopwords('english'))

> dtm <- DocumentTermMatrix(corpus)

# DTMをマトリックスに変換
> x <- as.matrix(dtm)
# 順位を、100を最高位、1が最小位となるよう、逆順に変換。(見やすさのため)
> y <- rev(1:100)
順位を計算して、結果を評価。
> performance <- data.frame()

# 0.1, 0.25, 0.5, 1, 2, 5 の Lambda ごとに計測を実行
> for (lambda in c(0.1, 0.25, 0.5, 1, 2, 5)) {
  for (i in 1:50) { # 50回試行

    # データを2つに分割
    indices <- sample(1:100, 80)

    training.x <- x[indices, ]
    training.y <- y[indices]

    test.x <- x[-indices, ]
    test.y <- y[-indices]

    # 単語一覧から順位を推定する正則化セットを取得
    glm.fit <- glmnet(training.x, training.y)

    # 指定したLambdaでの推定値を算出
    predicted.y <- predict(glm.fit, test.x, s = lambda)

    # RMSE
    rmse <- sqrt(mean((predicted.y - test.y) ^ 2))

    # 結果をデータフレームに格納
    performance <- rbind(performance,
                         data.frame(Lambda = lambda,
                                    Iteration = i,
                                    RMSE = rmse))
  }
}
> head(performance)
  Lambda Iteration     RMSE
1    0.1         1 34.85195
2    0.1         2 25.09364
3    0.1         3 26.98583
4    0.1         4 29.08673
5    0.1         5 32.75941
6    0.1         6 28.37690
図にしてみます。
> ggplot(performance, aes(x = Lambda, y = RMSE)) +
  stat_summary(fun.data = 'mean_cl_boot', geom = 'errorbar') +
  stat_summary(fun.data = 'mean_cl_boot', geom = 'point')
> ggsave(filename = "30.png")

図をみれば明らかなように、Lambdaの値が大きくなるとモデルはよくなっているが、これはちょうどモデルが切片に縮退しているときに起こっているもので、テキストデータは全く使っていないことを示すらしい。端的に言えば、今回の回帰で発見された手がかりはないらしい。失敗らしい。
ロジスティック回帰
順位予測は失敗でしたが、書籍が50位に入るかどうかの予測ならできるかもしれません。 ロジスティック回帰は、ある要素が2つのカテゴリの一つに属する確率を予測する、回帰の一種です。
まずは、ロジスティック回帰をデータセット全体に適用し、どうなるか見てみます。
# 順位を0 or 1に分類
> y <- rep(c(1, 0), each = 50)
# glmnetのfamilyを'binomial' にするとロジスティック回帰になる
> regularized.fit <- glmnet(x, y, family = 'binomial')
モデルの予測がどうなるか見てみます。
> predict(regularized.fit, newx = x, s = 0.001)
            1
1    4.573570
2    5.341867
3    4.668052
4    5.310955
5    4.869373
6    5.333862
7    4.487558
8    4.463377
9    5.352454
10   4.793254
11   5.352101
..
正の値/負の値が含まれるので、ifelseを使って、0/1に変換すれば、期待する予測値が得られます。
> ifelse(predict(regularized.fit, newx = x, s = 0.001) > 0, 1, 0)
    1
1   1
2   1
3   1
4   1
5   1
これを使って、書籍が50位以上に属するか推定してみます。
> set.seed(1)
> performance <- data.frame()

> for (i in 1:250) {
  indices <- sample(1:100, 80)

  training.x <- x[indices, ]
  training.y <- y[indices]

  test.x <- x[-indices, ]
  test.y <- y[-indices]

  for (lambda in c(0.0001, 0.001, 0.0025, 0.005, 0.01, 0.025, 0.5, 0.1)) {
    glm.fit <- glmnet(training.x, training.y, family = 'binomial')
    predicted.y <- ifelse(predict(glm.fit, test.x, s = lambda) > 0, 1, 0)

    error.rate <- mean(predicted.y != test.y)
    performance <- rbind(performance, data.frame(
                Lambda = lambda, Iteration = i, ErrorRate = error.rate))
  }
}
> ggplot(performance, aes(x = Lambda, y = ErrorRate)) +
  stat_summary(fun.data = 'mean_cl_boot', geom = 'errorbar') +
  stat_summary(fun.data = 'mean_cl_boot', geom = 'point') +
  scale_x_log10()
> ggsave(filename = "31.png")

lambaの値が小さいとき、偶然よりも良い予測になりました。

